
China PET bottle chip export situation brief in Jan-Jul 2021
According to the Customs, China PET chip export volume totals 293kt in Jul 2021, y-o-y growing 56%, including 48kt for HS code 39076910, y-o-y up 164%, and 245kt for HS code 39076110, y-o-y rising 44%. China PET chip export volume totals 2.15 million tons in Jan-Jul 2021, including 420kt for HS code 39076910, y-o-y up 110%, and 1.73 million tons for HS code 39076110, y-o-y rising 20%. Combing two HS codes, PET bottle chip trading volume totals 1.92 million tons in Jan-Jul 2021.
In terms of actual delivery, PET bottle chip exports in 2021 is not bad. So why do people have the impression that PET bottle chip export has performed poorly this year? As PET bottle chip price surged crazily in 2018, and exports in 2019 hit historical high of 3.15 million tons, many new comers thus thought this is a norm for PET resin export, hence when Jan-Jul export volume declined 8.5% compared with 2019, market players, it’s natural that some market participants feel disappointed.
The other reason is that there is not only new capacity commencing in the first half of this year, but also higher operating rate than in 2020. So the rising supply pressure has had higher expectations for exports. A round of intensive hoarding in Q4 2020-Q1 2021 allowed bottle chip factories to get through the first half of the year in low inventory. However, the continuous rise in sea freight rates has dampened industry expectations in the second half of the year. From July to August, PET bottle chip factories intensively cut back output.
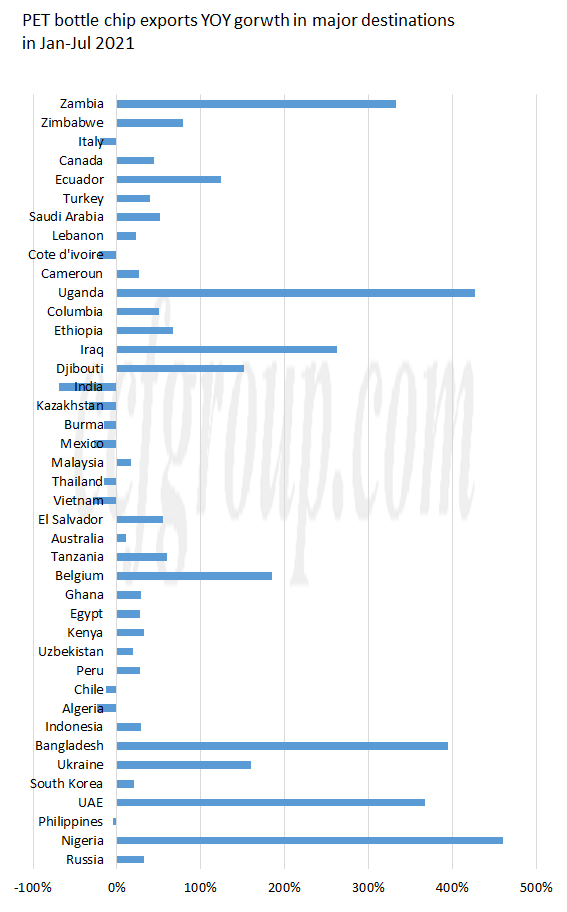
In Jan-Jul 2021, China PET bottle chip mainly headed to E. Europe, Southeast Asia, Africa and Middle East. Russia has increased its procurement from the Chinese mainland this year due to the problem of domestic railway transport capacity. Jan-Jul import volume from China has basically approached the total volume in 2020 and 2019 (130kt and 140kt respectively), reaching 118kt, an increase of 32% over the same period last year. Ukraine also saw a 160% year-on-year increase for similar reasons. Coke or other international water-related production plants are distributed all over the world, and the different rate of increase in sea freight rates has led to a divergence in export volume compared with the same period last year. For example, Nigeria grew by 460% year-on-year from January to July, while Algeria declined by 23%; Chile dropped by 13% year-on-year and Peru grew by 28%. On the whole, there are still a large number of rigid demand orders in Africa and South America, as it is easier to accept high prices than the losses caused by the suspension of production. At the same time, some local traders also took the opportunity to hoard a batch of goods near low prices.
In other areas, the sharp increase in imports is due to the occurrence of force majeure or output reduction in local plants, such as Belgium, where large-scale units once declared supply force majeure. As a result, imports of PET bottle chips from China in Jan-Jul increased by 185% compared with the same period last year. Although Mexico showed a decline in the total volume from January to July, the imports from June to July increased significantly compared with other months, mainly due to the decline in plant operating rate caused by local water shortage. Force majeure appeared in Brazil's Indorama plant in August, and local imports from China are also expected to increase significantly.
Of course, under the epidemic, the amount of all kinds of materials imported from Chinese mainland region is increasing in all regions of the world. On the one hand, due to the epidemic, the supply chain system is under pressure, and the efficiency of port distribution is low, resulting in congestion and poor turnover of empty containers, producers have to purchase raw materials in advance to prevent production loss due to lack of materials. So far, the shipping time of some routes has extended from original one month to about 4 months. On the other hand, although Chinese factories suffered a lot of losses from high freight rates in the early days, many orders turned to India and Southeast Asia, from the performance-to-price ratio of long-term transportation and supply delivery, at present, many major foreign customers still choose to purchase from Chinese manufacturers.
- Top keywords
- Cotton Price
- Cotton Futures Price
- Cotton Futures
- CZCE
- PTA Futures Price
- Chemical Fiber
- Polyester Prices
- Wool price
- PTA Futures
- Shengze Silk
- China
- Yarn Price
- price
- China Textile City
- Fibre Price
- Benzene Price
- Cotton
- Index
- Cotton Index
- PTA
- fabric price
- NYMEX
- Top 10
- textile industry
- Spot Cotton
- Cotton Yarn
- Polyester Price
- Futures
- PTA Price
- cotton yarn price