
Major shares changed in US textile and apparel imports
The latest data showed that US textile and apparel imports reached 8.3 billion square meters in Sep, up by 19.6% year-on-year but down 9.7% month-on-month respectively. The imports rose by 32.4% compared with that in same period of 2019. And the volume from China reached 3.87 billion square meters in Sep, up by 9.8% year-on-year but down 4.8% month-on-month respectively. The imports rose by 21% compared with that in same period of 2019.
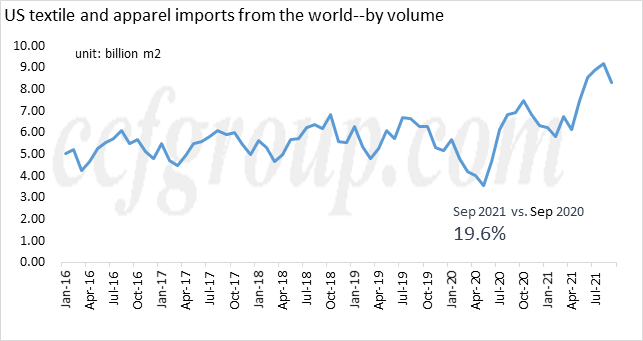
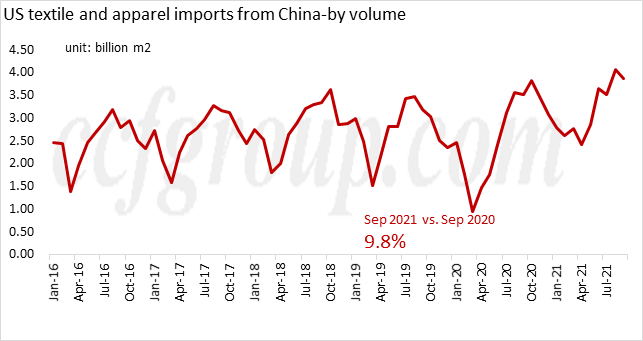
In Sep, US textile and apparel imports growth was still strong, of which the volume growth rate from China was lower than the overall, while the value growth rate was good, which had a big relationship with the unit price. Overall, in the first three quarters of this year, the US textile and apparel imports performed well, up more than 25% over the same period last year, of which the volume growth rate was significantly faster than that of the value. Compared with the situation before the pandemic in 2019, the volume still maintained a substantial growth, but the value decreased, which to a certain extent showed that the unit price or structure of US textile and apparel imports was changing this year.
Since 2015, the proportion of US textile and apparel imported from China has increased first and then declined, reaching 49.2% in 2018, and then gradually declining to 42.4% in the first three quarters of this year. The share of ASEAN relatively stabilized at 13-14%. The share of India and EU-27 increased significantly, to 9.4% and 5.7% respectively in the first three quarters of this year.
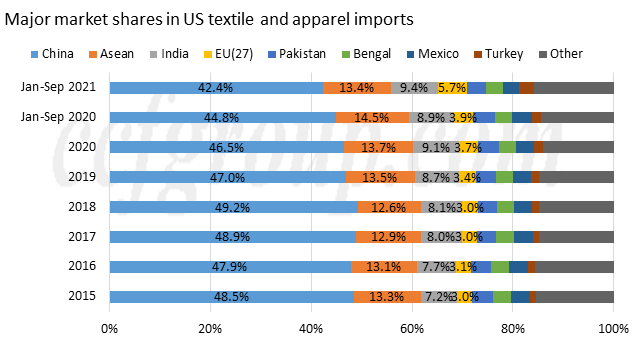
These were the top four import markets. In addition, Pakistan, Bangladesh, Mexico and Turkey’s market share in US textile and apparel imports has also changed. Pakistan, Bangladesh and Mexico’s market share declined in the first three quarters compared with the same period last year, while Turkey one increased. From the perspective of import unit price, the average unit price of US textile and apparel imports from China had not obvious advantage, on the contrary, it was gradually losing its price advantage.
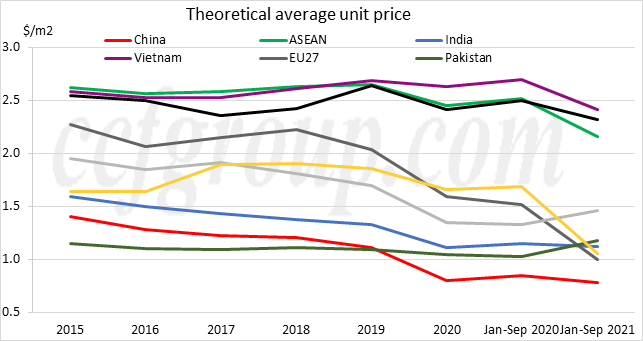
Note: the theoretical average unit price is the value divided by the volume
Judging from the theoretical average unit price over the years, the unit price of US textile and apparel imports from China was low, especially from last year to this year, while that of the imports Vietnam, ASEAN and Bangladesh was higher. Although the latter also declined this year, the overall level was on the high side. In addition, imports from EU-27 and Turkey declined obviously; the unit prices of US textile and apparel imports from Mexico and Pakistan rose this year. The change of unit price was mainly related to the exchange rate, the change of product structure and its own price. Textiles accounted for the largest proportion of US textile and apparel imports from China, and there has been a downward trend since 2015, so did that from India, Pakistan, Mexico, EU-27 and Turkey. Apparel accounted for the largest proportion in ASEAN and Bangladesh. ASEAN apparel accounted for more than 60%, and that of Bangladesh accounted for more than 80%. Product differences also led to differences in unit prices.
- Top keywords
- Cotton Price
- Cotton Futures Price
- Cotton Futures
- CZCE
- PTA Futures Price
- Chemical Fiber
- Polyester Prices
- Wool price
- PTA Futures
- Shengze Silk
- China
- Yarn Price
- price
- China Textile City
- Fibre Price
- Benzene Price
- Cotton
- Index
- Cotton Index
- PTA
- fabric price
- NYMEX
- Top 10
- textile industry
- Spot Cotton
- Cotton Yarn
- Polyester Price
- Futures
- PTA Price
- cotton yarn price